Monday, February 29, 2016

Manual Surface Tracking in OpendTect

Version: OpendTect 6.0

It is sometimes the case that an important reflection event we can see in 3D seismic data is not actually trackable due to inconsistent geology or poor data quality. We can still get a surface out of the data through the manual tracking workflow below. Note this does not use the Manual Tracking mode available on the Mode tab. By using the Auto-track mode we can make use of the v hotkey to make the horizon/seeds/surface visible in full or only at sections, a very handy feature the Manual Tracking mode does not have.
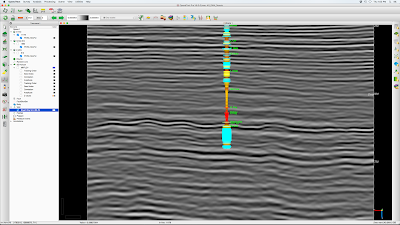
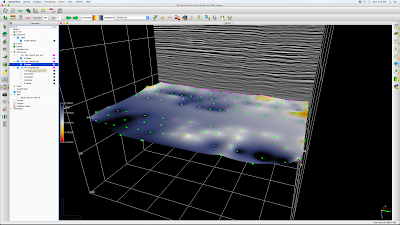
  1. Create new horizon with Mode tab: Section Auto-track, Event tab: Allowed difference (%) = 1, Correlation tab: Correlation threshold (%) = 99. This effectively shuts down tracking away from seed points, just leaving the seeds (Fig. 1). The example given here is the seismic unconformity between Middle and Lower Fayetteville SH in the Desoto 3D seismic survey of NE Conway County, AR (data credit: SWN).
  2. Pick the horizon on, say, every 10th line to make a point cloud, then right-click on the horizon name to choose Tools > Gridding ... creating a grid (Fig. 3)
  3. Usually a good idea to smooth the grid  (Tools > Filtering ...) as in Fig. 4 where a 7x7 bin smoothing has been applied. 
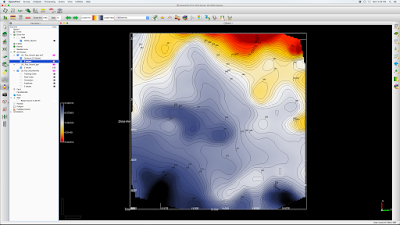
  4. Once a smooth grid is obtained, add contours in the usual way (Fig. 5).


Fig. 1 Crossline 1685 PSTM data showing subtle unconformity a bit below 500 ms.

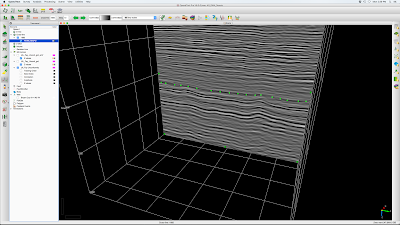
Figure 2. Seeds manually picked along the unconformity.
Figure 3. Seeds picked on every 10th cross line and gridded.
Figure 4. Gridded unconformity surface after 7x7 bin smoothing

Figure 5. Unconformity horizon time structure with contours.

Bryant Coy well with deflection as velocity and colored by gamma ray, showing subtle unconformity at M/L Fayetteville interface. 

Sunday, February 28, 2016

MS Thesis Outline


  1. Abstract 
  2. Introduction 
    1. Statement of the problem (Hypothesis) 
    2. Previous investigations... who has published in the area before; include UA theses; how does your study differ from theirs?
  3.  Geologic Setting 
    1. What is the tectonic, structural and stratigraphic history of your study area?
    2. Detailed description up to the age of your study horizon, cursory for later formations
  4. Data Description 
    1. 3D seismic...size, bin, resolution, vintage
    2. Wireline data...well locations, which logs, which intervals
    3. Outcrop...location, description, measured section
  5. Methods 
    1. What work did you actually do? 
    2. Workflow and discussion of limitations
  6. Results
    1. Maps, quantification 
  7. Conclusions / Observations 
    1. Relate back to hypothesis...proved or disproved?
  8. Acknowledgements
    1. Committee, data donors, software donors, financial support, advisors not on committee
  9. Tables 
  10. Figures 
    1. Each original or modified figure is composed as a PPT slide
  11. Appendices

Research hypothesis

Your MS thesis should be built around a research hypothesis or, equivalently, a research question. Once your hypothesis is set, through discussion with your advisor, then it puts a fence around all thesis work and writing. Your hypothesis should be front and center in the thesis proposal. Anything that goes toward proving or disproving your hypothesis should be in the thesis.

A PhD student will have a main hypothesis for the dissertation and three minor hypotheses, one each for the three peer-reviewed publications expected to come from the PhD work.

Example hypotheses:

Lance Ababa (PhD)
Paleokarst is an important controlling factor in carbonate hydrocarbon reservoirs worldwide.

Bryan Bottoms
Geochemical and isotope analysis can demonstrate that Pb-Zn mineralization in the Tri State Mining District and in Northern Arkansas is sourced from the Chattanooga Shale.

John Gist
Understanding of the origin of tripolitic chert in the Mississippian Boone formation can be improved by mapping its spatial and stratigraphic distribution.

Ryan Keeling
Modern 3D seismic data can image internal stratigraphy and probable porosity zones in the Arbuckle formation of Osage Co., OK.

Thomas Liner
The subsurface distribution of tripolitic chert can be correlated to natural gas production from the Mississippian Boone Formation in NW Arkansas.

Daniel Moser
3D Seismic interpretation of lower Mississippian formations in NE Conway Co., AR show evidence of paleokarst topography.

Matthew Ruggeri
Near surface seismic methods can extend geological information at the Mississippian Boone Pedro outcrop in Washington Co., AR.

Joshua Stokes
It is possible to estimate hydrocarbon reservoir potential of Morrowan carbonate (?) channels through integrated interpretation of 3D seismic data, subsurface geology, production and completion techniques in Kearny and Finney Counties, KS.

 The research hypothesis can be converted to a research question with just a minor change of wording:

Lance Ababa (PhD)
Is paleokarst an important controlling factor in carbonate hydrocarbon reservoirs worldwide?
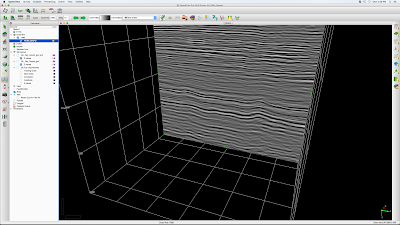
Transferring OpendTect well data between users

Email exchange with Josh Stokes shows how this can be done. Same workflow should work for horizons folder.
--------------------------------
From Dr. Liner:

I loaded the Johnson 1 well in opendtect and applied the time-depth curve that came from my synthetic calculation. As an experiment in sharing well data, attached is a zip file of the Wellinfo folder in my Amazon Ditch opendtect project. If you can use it, then you will immediately get the Johnson well loaded and ready to go. Steps...
  1. close opendtect
  2. rename your odata/KS_Devon_AmazonDitch/Wellinfo folder odata/KS_Devon_AmazonDitch/Wellinfo_old
  3. drop the zip file in your odata/KS_Devon_AmazonDitch folder
  4. double click to unzip the file, a Wellinfo folder will be created
  5. open opendtect and run usual session file
  6. open XL 508
  7. add Johnson 1 well from project tree
  8. the well should show up
Let me know if it works

Reply from Josh:

It worked perfectly! Thanks so much for getting me set up.

I’ll let you know if there are any quirks, but so far so good.

Friday, February 26, 2016

Surviving the '80s panel discussion

On Wednesday December 2, 2015 the AAPG Student Chapter in the Geosciences Department of the University of Arkansas convened a panel discussion on Surviving the '80s. Chapter President Abram Barker chaired the session and panelists were:
  1. Christopher Liner (professor of geosciences, U of Arkansas)
  2. Mac MacGilvery (ConocoPhillips, retired)
  3. Robert Liner (Stephens Prod. Co., geological manager)
  4. Gerry Lundy (Hogback Exploration, owner)
  5. Steve Milligan (Lawco Energy, geophysicist)
  6. Philip Shelby (Lawco Energy, geologist)
The discussion centers around experiences and advice from the panel about how they made it through the 1985-8 severe oil & gas industry downturn, the best good analogy for the situation today. For a graphical representation of the current downturn, see this page on Prof. Liner's Seisms Blog. Based on analysis of the north america rig count, it seems the current downturn is just as deep (70% drop) as the 1980's, but has taken half the time to get there. Prevailing opinion has any kind of oil price recovery 12-24 months away.

The panel discussion audio file is available here (80MB, m4a format).

The AAPG Student Chapter expresses deep appreciation for the panelists who participated in this event.