Monday, October 10, 2016

Petra Projects

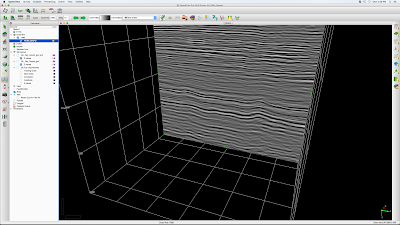
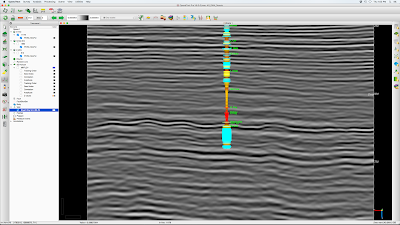
Some of our geology masters students do mapping projects using IHS Petra software. We try to capture these Petra project files so that future students can benefit from those who went before. Dr. Liner is the keeper of some Petra projects and Jamie Woolsey also maintains several.

Some Petra projects:

NE OK and NW AR (Kevin Liner, 2014)

Arkansas raster logs (Jamie Woolsey, 2015)

Western Arkoma Basin (Yueyang Wang, 2016)

Thursday, June 30, 2016

Geology TA Application Process for Spring 2017

The Spring 2017 semester applications admissions and teaching assistantships will be due October 15th. The coming fall semester assitantships and positions have already been filled.  

To complete the application go to: 
https://application.uark.edu/

From there the grad school will assign you a login name and password. (give that a few days).
After that upload all necessary materials including statement of purpose and CV. Be sure to mention you are interested in a teaching assistantship

Teaching assistantships ($11,000 for 9 months for MS level, $13,000 for 9 months PhD level) in the department typically involve teaching undergraduate intro geology, and occasionally upper division undergrad classes. Research assistantships are dependent on your thesis advisor. If they have money for an RA, basically. 

Additional information can be found at the department website: 

(info from Dr. Celina Suarez, Geology graduate student coordinator)

Monday, March 14, 2016

Basic Depth Conversion in OpendTect

Version: OpendTect 6.0.1

We routinely track a horizon in OpendTect to make time structure and horizon amplitude maps. But we would also like to make at least a basic contoured depth map. This is the simplest possible depth map since we are using a constant velocity for depth conversion. In areas of subtle structure it should be reasonably accurate. Here is the workflow:
  1. This example is in the Wild Creek 3D survey, the horizon is a Lower Penn (LPenn) horizon, just below Oswego (Fig. 1) and the well is the Modica_1A-17. Even though this well is projected from 1.5 miles away, we will use it for this example. (Seismic data credit: Osage Nation Minerals Council; Well data credit: Spyglass Energy).
    1. Numbers we need.... 
      1. Wild Creek Survey = +1200 ft = SRD... seismic reference datum
      2. Modica_1A-17  = +954 ft = KB ... kelley bushing
      3. Event time at Modica Well = 0.533 sec = T ... reflection time
      4. Event depth at Modica Well = 2575 ft = MD ... measured depth from KB
      5. Event depth at Modica Well = 953 - 2575 = -1622 ft TVDSS ... depth sub-sea
    2. calculate depth conversion velocity
      1. V = 2*(MD - KB + SRD)/T = 2*(2575 - 953 + 1200)/0.533 = 10589 ft/s.... this is our constant velocity for depth conversion. The velocity will scale horizon times to depth from SRD. This depth will need to be subtracted from SRD to get TVDSS.
  2. In the project tree add your 3D horizon and make the usual time maps
    1. Horizon time structure with contours (Fig. 2)
    2. Horizon amplitude with time structure contour overlay (Fig. 3)
  3. On the top toolbar choose the Edit Attributes icon 
    1. Choose the <All>/Horizon attribute for your horizon and data type and Z output. Name this attribute T_LPenn and Add As New (Fig. 4)
    2. Choose the <All>/Mathematics attribute for your horizon and implement the depth conversion equation TVDSS = SRD - V * T / 2 and for 'T' use T_LPenn.  Name this attribute TVDSS_LPenn and Add As New (Fig. 5)
  4. On the project tree under the LPenn horizon add the T_LPenn attribute, then right click on T_LPenn and select Save As Horizon Data... 
  5. On the project tree under the LPenn horizon add the TVDSS_LPenn attribute, then right click on TVDSS_LPenn and select Save As Horizon Data... 
  6. Add contours for T_LPenn (Fig. 6) and TVDSS_LPenn (Fig. 7)
    1. Zoom near Modica well of TVDSS_LPenn color and contour map shows sub-sea depth near well is within 5 ft of the correct -1622 ft value (Fig. 8)
Figure 1. LPenn event (red) and Modica well with formation tops

Figure 2.  LPenn time structure (color and 4 ms contours)

Figure 3. LPenn amplitude and time structure contours

Figure 4. Horizon attribute defining T_LPenn

Figure 5. Mathematics attribute defining TVDSS_LPenn

Figure 6. LPenn time structure (T_LPenn) with 2 msec contours
Figure 7. LPenn TVDSS with 10 ft contours


Figure 8. Zoom LPenn TVDSS with 5 ft contours


Tuesday, March 8, 2016

Isochron and Isopach Maps in OpendTect

Version: 6.0

The example given here is the interval between Upper Fayetteville SH and the Boone LS in the Desoto 3D seismic survey of NE Conway County, AR (data credit: SWN). Horizon tracking by Daniel Moser.

Definitions
Isochron map: Seismic two-way interval time between two horizons
Isopach map: Thickness interval between two geological or seismic horizons

  1. In the project tree add two horizons A and B, here A=U_Fay_Smooth (Fig 1) and B=Boone_Smooth (Fig 2)The A horizon is shallower than B.
  2. Right click on shallower horizon U_Fay_Smooth and select Workflows > Calculate Isochron ...
    1. In the isopach parameter window set Calculate to menu to Boone_Smooth  use default attribute name I:Boone_Smooth, and output result in msec. 
    2. You will see there is a new attribute I:Boone_Smooth in the U_Fay_Smooth tree list. 
  3. Right click on the I:Boone_Smooth attribute and select Tools > Set Z Values ...
  4. In the parameter window select: Values are Relative (deltas), Units are msec, Save Horizon As new, output horizon name UFay_Boone_iso and check the Display after create box. This will generate a horizon representing the isochron between the horizons. Contours can be added to show the isochron between these two horizons (Fig 3).
U_Fay_smooth horizon time structure with 2 ms contours

Boone_smooth horizon time structure with 2 ms contours

Fay-Boone isochron with 2 ms contours


Not yet... generate isopach from isochron (CL)
  1. Choose menu item Scene>New[Depth]. In the parameter box select Linear Velocity and set the Vint parameter to 12000 ft/s (from averaging of sonic velocity between U Fay and Boone) and set gradient to zero. This forces a constant velocity depth conversion. Select OK.
  2. A new project tree window appears below the previous project tree along with the new scene window. Minimize the original scene window and maximize the new one.
  3. In the depth scene add the UFay_Boone_iso horizon 

Monday, March 7, 2016

Traditional Horizon Tracking in Faulted Terrain

Version: OpendTect 6.0

This entry explains how to use OpendTect to track horizons in faulted areas by working in vertical sections.

We will assume that the work area is small, there are only a few faults and these can be identified as individuals allowing named faults to be used from the outset.

Here is the workflow for a region of interest (ROI):
  1. Identify fault block and horizon of to be mapped
  2. Identify faults that bound your fault block
  3. Scan through ROI on inlines (IL) and cross lines (XL) and determine which gives best view of horizon and faults in ROI. We assume you will work on IL sections here.
  4. On the project tree create a pickset and place a pick on your horizon and its correlation across faults that bound your block. Note what IL the picks are on
  5. Create horizon and set appropriate tracking parameters
  6. Create all faults you will need, naming them logically (e.g., F1, F2, F3, etc)
  7. Go to the IL that gives the best view of your faults and horizon correlation across them
    1. Set IL jump to 20, 10 or 5 depending on size of area and complexity of structure
    2. Select horizon from project tree and place seeds at each end of each fault block as close to the fault location as possible
    3. Select F1 from project tree and place picks. Be as consistent as possible on picking shallowest and deepest fault point on each IL
    4. Same for F2, F3, etc.
    5. Jump to next IL location, make horizon and faults only visible at sections (hotkey v) and repeat steps 7-2 through 7-4
  8. Go to Z-North view
    1. Hide all faults
    2. Make horizon visible in full (hotkey v), you should see all the seeds you picked.
    3. From the tracking parameter window, select Retrack All. This forces tracking from all seed points simultaneously. 
    4. Assuming you have the entire data set preloaded, watch until your horizon tracking progresses beyond your ROI, then hit the red Stop Auto Tracking button on the tracking parameter window. 
  9. Review the time structure map for jumps that indicate tracking busts inside fault blocks. We expect time structure jumps at faults. 
  10. If there are tracking busts
    1. Repeat step 7 in the bust area with a smaller IL jump interval
    2. Repeat step 8
    3. Repeat step 9
  11. If there are no tracking busts
    1. Make faults visible (hotkey v)
    2. Select horizon on project tree and use polygon/rectangle tool to trim tracked area to ROI
  12. Make contours, show amplitude, etc for final display
Figure 1. Vertical seismic IL section with pickset points identifying horizon to be mapped

Figure 2. Same IL after defining horizon and faults, then picking them in this line

Figure 3. Map view of horizon seeds (green) and traced ILs (red)

Figure 4. Final after auto tracking, trimming to region of interest, adding time structure contours and 3D display with faults


Friday, March 4, 2016

OpendTect Fault Mapping in Time Slices

Version: OpendTect 6.0

We generally think about mapping faults in vertical seismic sections because the fault offset is visible and we are used to this view from outcrop work. However, in terrain with complex faulting this approach is limited. For example, it may be that faults are oblique to both the inline (IL) and cross line (XL) directions, are strike-slip or oblique-slip with little or no vertical throw and therefore would be undetectable on in the vertical view, or the fault network is very complex and difficult to unravel from vertical sections.

A 3D seismic fault mapping workflow in these difficult situations for OpendTect 6.0 is given below. The example is from the Vermillion area offshore Louisiana in the Gulf of Mexico (data credit: FairfieldNodal). This data has bin size 55x55 ft and time sample rate of 6 ms.
  1. Identify the fault block (FB) to be mapped using IL and XL seismic amplitude sections (Fig 1).
  2. Open a time slice (TS) at the FB level displaying seismic amplitude PSTM data (Fig 2). Although major faults will likely be visible in the amplitude data, subtle faults will be overlooked if we interpret faults on this data type. 
    1. The fault mapping attribute we want to use is similarity. In this example a similarity data cube has been computed with vertical window of +/- 48 ms.  Long-window similarity provides a good image of faults that are nearly vertical over the extent of the time window (~100 ms in this case). Display similarity in the TS to reveal a much better view of the fault network (Fig 3).
  3. Set the time slice step to 60 ms and move TS up above the block of interest, but be sure the faults of interest are still present (Fig 4). 
  4. Create a new fault and save as F1, set color to Cyan. In the TS, click along the fault (Fig 5). Step down TS by 60 ms picking this fault in each slice. As with horizons, the 'v' key toggles between 'show in full' and show the fault only in the working TS. In the example, this process allows construction of the fault from 1960-2500 ms (Fig 6, Fig 7). Note that in the vertical view the constructed fault shows an un-geologic zig-zag pattern related to the window length of the similarity attribute used. Picking faults directly in vertical sections can be done in simpler areas to yield a more geologically reasonable fault line, but the method given here is good enough in complex areas.
  5. Create new fault and save as F2, set color to yellow. Repeat as above on cross fault.
  6. Create new fault and save as F3, set color to magenta. Repeat as above on N fault.
  7. This process maps all faults around the block of interest as seen on similarity (Fig 8) and PSTM (Fig 9). A 3D view is given in Fig 10.
Fig 1. PSTM inline section with yellow pick point on fault block to be mapped. 

Fig 2. Time slice through PSTM data at pick point level.

Fig 3. Similarity data gives a much better map view of faults.

Fig 4. Similarity TS above the horizon of interest.

Fig 5. Fault F1 created and picked in shallow TS.

Fig 6. IL view of horizon and F1 fault shown only in section.

Fig 7. IL view of horizon and F1 fault shown in full.

Fig 8. Repeating the process for faults F2 (yellow) and F3 (magenta), surrounds the block of interest.

Fig 9. All faults shown on PSTM data. It would not have been possible to pick faults to this accuracy on PSTM data alone.

Fig 10. 3D view of TS, IL, event pick and faults surrounding the block of interest.

Monday, February 29, 2016

Manual Surface Tracking in OpendTect

Version: OpendTect 6.0

It is sometimes the case that an important reflection event we can see in 3D seismic data is not actually trackable due to inconsistent geology or poor data quality. We can still get a surface out of the data through the manual tracking workflow below. Note this does not use the Manual Tracking mode available on the Mode tab. By using the Auto-track mode we can make use of the v hotkey to make the horizon/seeds/surface visible in full or only at sections, a very handy feature the Manual Tracking mode does not have.
  1. Create new horizon with Mode tab: Section Auto-track, Event tab: Allowed difference (%) = 1, Correlation tab: Correlation threshold (%) = 99. This effectively shuts down tracking away from seed points, just leaving the seeds (Fig. 1). The example given here is the seismic unconformity between Middle and Lower Fayetteville SH in the Desoto 3D seismic survey of NE Conway County, AR (data credit: SWN).
  2. Pick the horizon on, say, every 10th line to make a point cloud, then right-click on the horizon name to choose Tools > Gridding ... creating a grid (Fig. 3)
  3. Usually a good idea to smooth the grid  (Tools > Filtering ...) as in Fig. 4 where a 7x7 bin smoothing has been applied. 
  4. Once a smooth grid is obtained, add contours in the usual way (Fig. 5).


Fig. 1 Crossline 1685 PSTM data showing subtle unconformity a bit below 500 ms.

Figure 2. Seeds manually picked along the unconformity.
Figure 3. Seeds picked on every 10th cross line and gridded.
Figure 4. Gridded unconformity surface after 7x7 bin smoothing

Figure 5. Unconformity horizon time structure with contours.

Bryant Coy well with deflection as velocity and colored by gamma ray, showing subtle unconformity at M/L Fayetteville interface. 

Sunday, February 28, 2016

MS Thesis Outline


  1. Abstract 
  2. Introduction 
    1. Statement of the problem (Hypothesis) 
    2. Previous investigations... who has published in the area before; include UA theses; how does your study differ from theirs?
  3.  Geologic Setting 
    1. What is the tectonic, structural and stratigraphic history of your study area?
    2. Detailed description up to the age of your study horizon, cursory for later formations
  4. Data Description 
    1. 3D seismic...size, bin, resolution, vintage
    2. Wireline data...well locations, which logs, which intervals
    3. Outcrop...location, description, measured section
  5. Methods 
    1. What work did you actually do? 
    2. Workflow and discussion of limitations
  6. Results
    1. Maps, quantification 
  7. Conclusions / Observations 
    1. Relate back to hypothesis...proved or disproved?
  8. Acknowledgements
    1. Committee, data donors, software donors, financial support, advisors not on committee
  9. Tables 
  10. Figures 
    1. Each original or modified figure is composed as a PPT slide
  11. Appendices

Research hypothesis

Your MS thesis should be built around a research hypothesis or, equivalently, a research question. Once your hypothesis is set, through discussion with your advisor, then it puts a fence around all thesis work and writing. Your hypothesis should be front and center in the thesis proposal. Anything that goes toward proving or disproving your hypothesis should be in the thesis.

A PhD student will have a main hypothesis for the dissertation and three minor hypotheses, one each for the three peer-reviewed publications expected to come from the PhD work.

Example hypotheses:

Lance Ababa (PhD)
Paleokarst is an important controlling factor in carbonate hydrocarbon reservoirs worldwide.

Bryan Bottoms
Geochemical and isotope analysis can demonstrate that Pb-Zn mineralization in the Tri State Mining District and in Northern Arkansas is sourced from the Chattanooga Shale.

John Gist
Understanding of the origin of tripolitic chert in the Mississippian Boone formation can be improved by mapping its spatial and stratigraphic distribution.

Ryan Keeling
Modern 3D seismic data can image internal stratigraphy and probable porosity zones in the Arbuckle formation of Osage Co., OK.

Thomas Liner
The subsurface distribution of tripolitic chert can be correlated to natural gas production from the Mississippian Boone Formation in NW Arkansas.

Daniel Moser
3D Seismic interpretation of lower Mississippian formations in NE Conway Co., AR show evidence of paleokarst topography.

Matthew Ruggeri
Near surface seismic methods can extend geological information at the Mississippian Boone Pedro outcrop in Washington Co., AR.

Joshua Stokes
It is possible to estimate hydrocarbon reservoir potential of Morrowan carbonate (?) channels through integrated interpretation of 3D seismic data, subsurface geology, production and completion techniques in Kearny and Finney Counties, KS.

 The research hypothesis can be converted to a research question with just a minor change of wording:

Lance Ababa (PhD)
Is paleokarst an important controlling factor in carbonate hydrocarbon reservoirs worldwide?


Transferring OpendTect well data between users

Email exchange with Josh Stokes shows how this can be done. Same workflow should work for horizons folder.
--------------------------------
From Dr. Liner:

I loaded the Johnson 1 well in opendtect and applied the time-depth curve that came from my synthetic calculation. As an experiment in sharing well data, attached is a zip file of the Wellinfo folder in my Amazon Ditch opendtect project. If you can use it, then you will immediately get the Johnson well loaded and ready to go. Steps...
  1. close opendtect
  2. rename your odata/KS_Devon_AmazonDitch/Wellinfo folder odata/KS_Devon_AmazonDitch/Wellinfo_old
  3. drop the zip file in your odata/KS_Devon_AmazonDitch folder
  4. double click to unzip the file, a Wellinfo folder will be created
  5. open opendtect and run usual session file
  6. open XL 508
  7. add Johnson 1 well from project tree
  8. the well should show up
Let me know if it works

Reply from Josh:

It worked perfectly! Thanks so much for getting me set up.

I’ll let you know if there are any quirks, but so far so good.

Friday, February 26, 2016

Surviving the '80s panel discussion

On Wednesday December 2, 2015 the AAPG Student Chapter in the Geosciences Department of the University of Arkansas convened a panel discussion on Surviving the '80s. Chapter President Abram Barker chaired the session and panelists were:
  1. Christopher Liner (professor of geosciences, U of Arkansas)
  2. Mac MacGilvery (ConocoPhillips, retired)
  3. Robert Liner (Stephens Prod. Co., geological manager)
  4. Gerry Lundy (Hogback Exploration, owner)
  5. Steve Milligan (Lawco Energy, geophysicist)
  6. Philip Shelby (Lawco Energy, geologist)
The discussion centers around experiences and advice from the panel about how they made it through the 1985-8 severe oil & gas industry downturn, the best good analogy for the situation today. For a graphical representation of the current downturn, see this page on Prof. Liner's Seisms Blog. Based on analysis of the north america rig count, it seems the current downturn is just as deep (70% drop) as the 1980's, but has taken half the time to get there. Prevailing opinion has any kind of oil price recovery 12-24 months away.

The panel discussion audio file is available here (80MB, m4a format).

The AAPG Student Chapter expresses deep appreciation for the panelists who participated in this event.

Saturday, January 2, 2016

MS Proposal Template

A new beginning in 2016. With SEG DISC (2012) and Presidential (2012-2015) duties behind me, I can finally spin off a graduate student blog specific to my University of Arkansas Geoscience MS and PhD students.

First up is the MS proposal. This should be scheduled during the second semester of study.

The thesis proposal document should  be in thesis format up to 10 pages long, including figures and bibliography. The proposal doc should be approved by the thesis advisor then shared with the entire thesis committee a few days before defense. Here is a PDF example. Note this example has low-resolution graphics to reduce file size, your proposal document should have highest graphics resolution available. Also, both proposal document and associated slides should clearly identify faculty advisor and committee members (which this one does not).

My students usually propose in the geophysical equipment lab (Gearhart 109), check with me for availability. At the proposal meeting, the candidate can expect the following:
  1. You will give a brief summary of your background to the committee and guests
  2. You will give an oral slide presentation (15-20 min) of your proposal in sync with the written document
  3. The slides should end with a detailed work plan and timeline, including courses taken and planned
  4. Questions from the public audience, then audience excused
  5. Questions from the committee
  6. Candidate is excused for committee discussion
  7. Candidate returns for committee decision and suggestions